My goal with this retrospective is to do the best I can to explain my thought process through this historic event from start to finish, and hopefully provide some semblance of insight for those asking “why” or “how” this flood event occurred. There’s certainly things I would have liked to do better, and for better or worse, whenever there is a weather-related loss of life in this area I take it personally. I did on May 15th, 2018, and I do today.
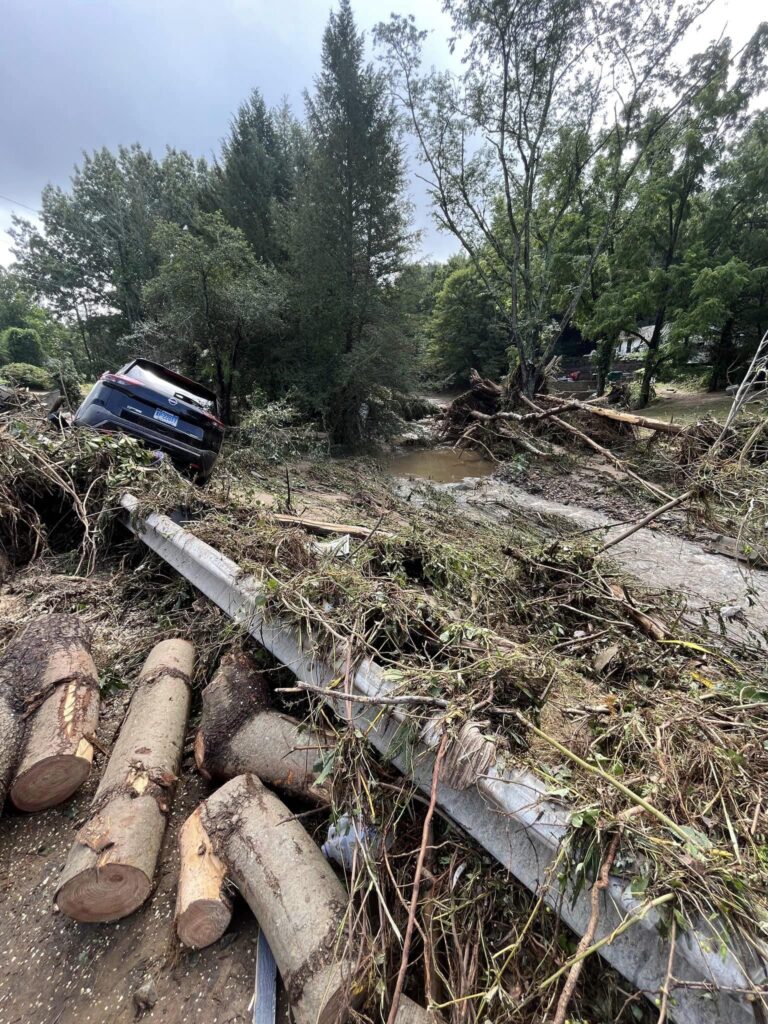
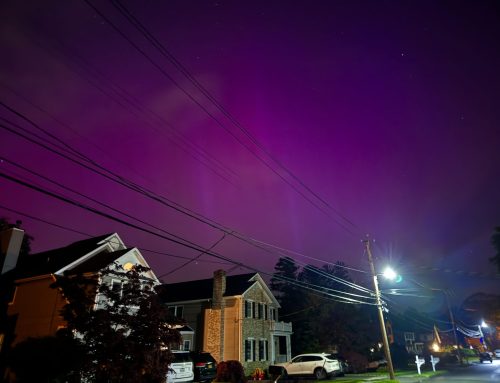
Kirk Giglio Photography
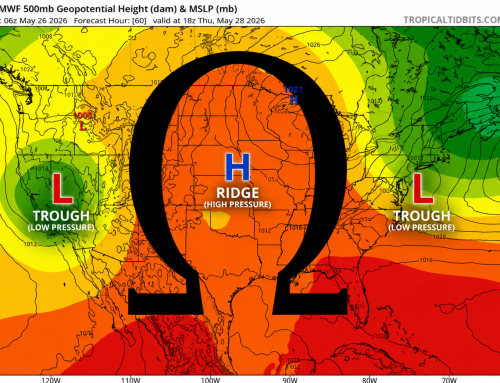
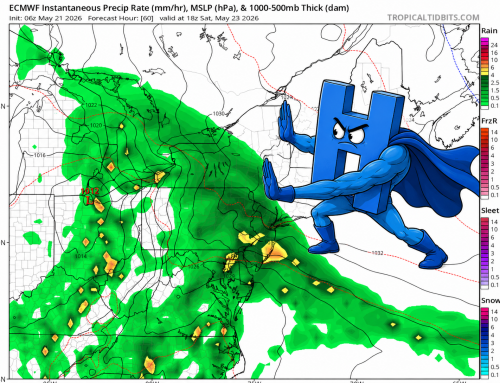
To start, I still have forecasts up on my page from late Thursday and Friday discussing how the models had “backed off rain for the weekend.” As some of the comments have noted, this did indeed age poorly. While it looked like New York and Pennsylvania would get a lot of rain, models originally kept high pressure in command and didn’t allow the approaching frontal system to reach CT. It was a close call, but it looked like the rain would set up 50-100 miles west of us.
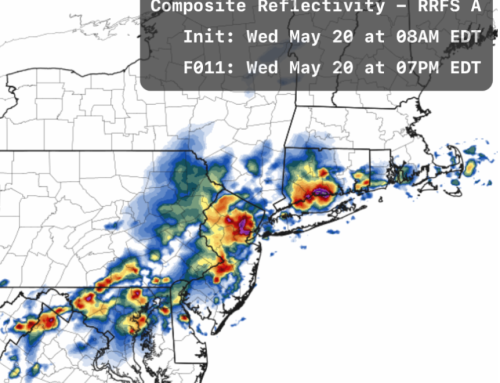
While this solution held true on Saturday, as we got closer to Sunday, models became split. Maybe it’s because I’m a younger meteorologist, but I am a huge fan of short range models – namely the high resolution NAM and HRRR which I share often. These models in particular started to introduce more rain for Sunday about 24 hours out, which was a red flag to my previously optimistic forecast. While confidence was low, I began to introduce more rain into my forecast for Sunday, but was not aggressive with wording regarding flooding. By Saturday night, both the NAM and the HRRR were showing heavy rainfall and significant totals up to 6 inches in Western CT. At this point, I noted the excessive rainfall and flood potential in a couple of different posts, but with global models (Euro, GFS, CMC) still further west, no Flood Watches were issued from the NWS.
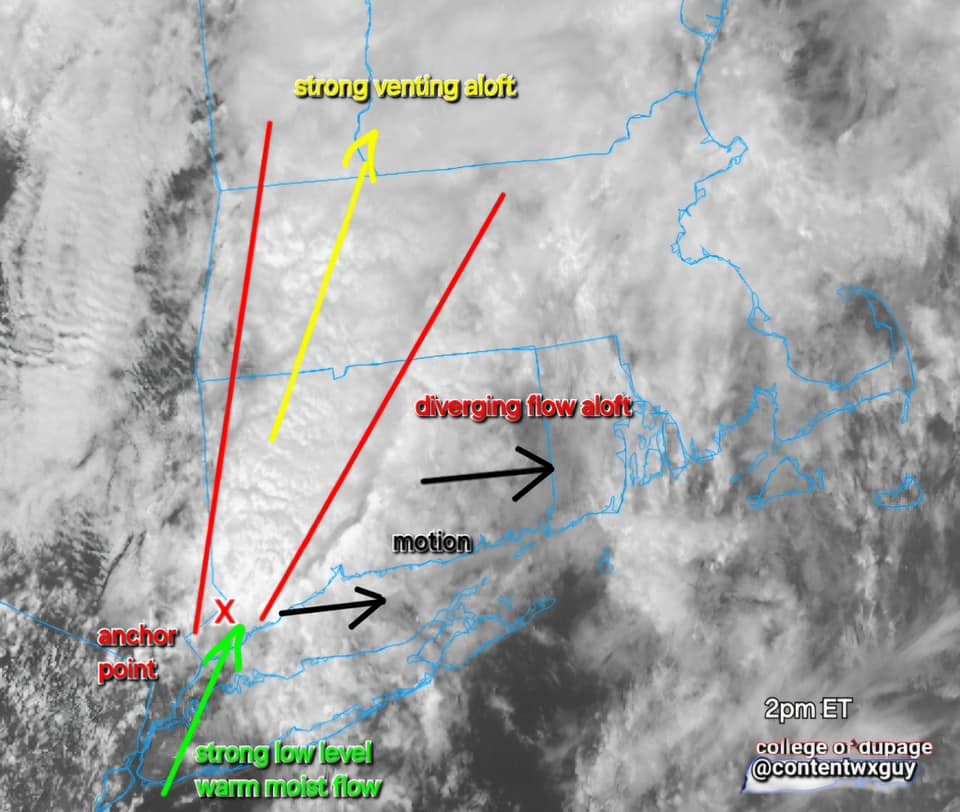
The atmosphere on Sunday was primed for heavy rainfall, and the short range models picked this up, at least to some extent. The column was very moist with PWATs (Precipitable Water) values near 2.0 inches. Additionally, the boundary the storms formed along was very slow moving, meaning storms could continue to fire over and over again in the same spot. This can cause what’s known as “training” thunderstorms. The last key ingredient was the development of a very moist low level jet from the south, which created a conveyor belt of moisture from the Atlantic. This, aided by our local topography, allowed for aggressive rainfall rates within storms. The low level jet (LLJ) was under-modeled rather significantly, and ended up being observed around 45 knots as opposed to an expect 20 knots. Below is a very well done diagram of the meteorological process from @ContentWxGuy on X.
I woke up around 7:45AM Sunday and immediately became concerned by the radar, which showed a large batch of heavy showers working into shoreline areas. From there it was a bit of a scramble to get things out, and I pieced together a post hitting the flooding wording harder. Soon after, it was simply real time “nowcasting” as training showers and storms encroached more and more on the area. The first Flash Flood Warning was about 9:30AM and did include many of what ended up being the hardest hit communities. Initially, places like Stamford, Darien, and Norwalk had the most issues, but the flooding quickly spread NE during the morning.
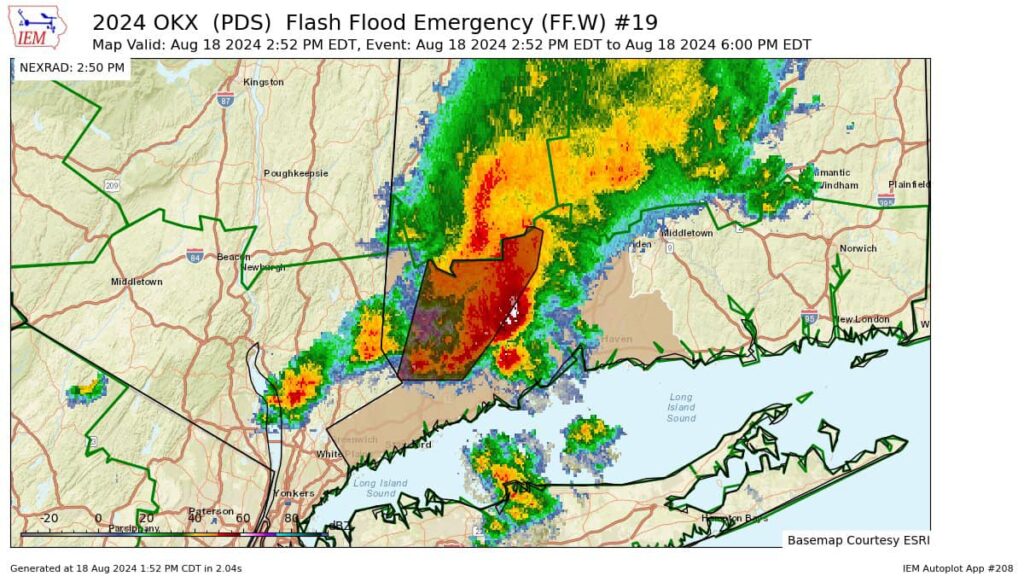
At 12:25PM the Flash Flood Warning was expanded North a bit to Danbury and Brookfield, as heavy showers and storms continued to slowly migrate northeast. Soon after Litchfield County was added. At 2:54PM a rare and very serious Flash Flood Emergency was issued for much of the hardest hit area. Any time you hear “Emergency” in a weather warning, it really is a life and death situation. This warning also carried a “catastrophic” damage tag, which we never want to hear. This is when the heaviest rain of the day fell on Southbury, Oxford, Monroe, and Seymour. The flooding in these areas was indeed catastrophic, and the worst I’ve personally ever witnessed. This is just my personal opinion, but I do think the fact this escalated on a Sunday morning (kind of an off-day for local news) made the messaging lag a little more. This, combined with the forecast changes and lack of consensus from the global models, allowed for many folks to be caught off guard.
I will say that I’m not sure, given the data and setup, there was a lot that could have been done better in this situation. Weather events like these occur on a small scale the models do not resolve well. Honestly, while the totals are shocking (10 to 16 inches in some areas), the amount of days with near record PWATs has become greater and greater and it is only a matter of time before this happens again. If there is one thing I’m fairly confident we’ll see more of in the future, it is flash flood events.
I wanted to thank each and every person on here who shared storm reports and has supported this page. Thank you to all the first responders who I am honored to forecast for, and who did amazing work yesterday given very difficult conditions. Also a special thank you to storm chaser Kirk Giglio who drove down to document this disaster, and allowed me to share photos on here that tell the story better than words ever could. All of us at CT Weather continue to pray for those who passed away and their families… as well as all those affected.
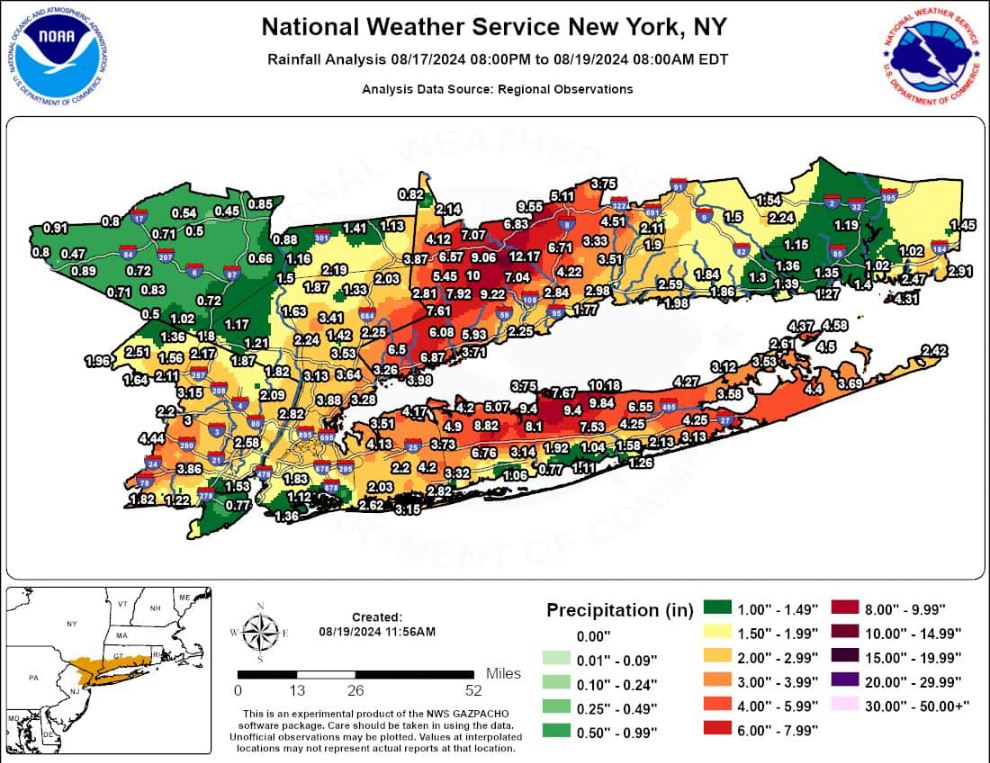
Storm Total Rainfall per NWS