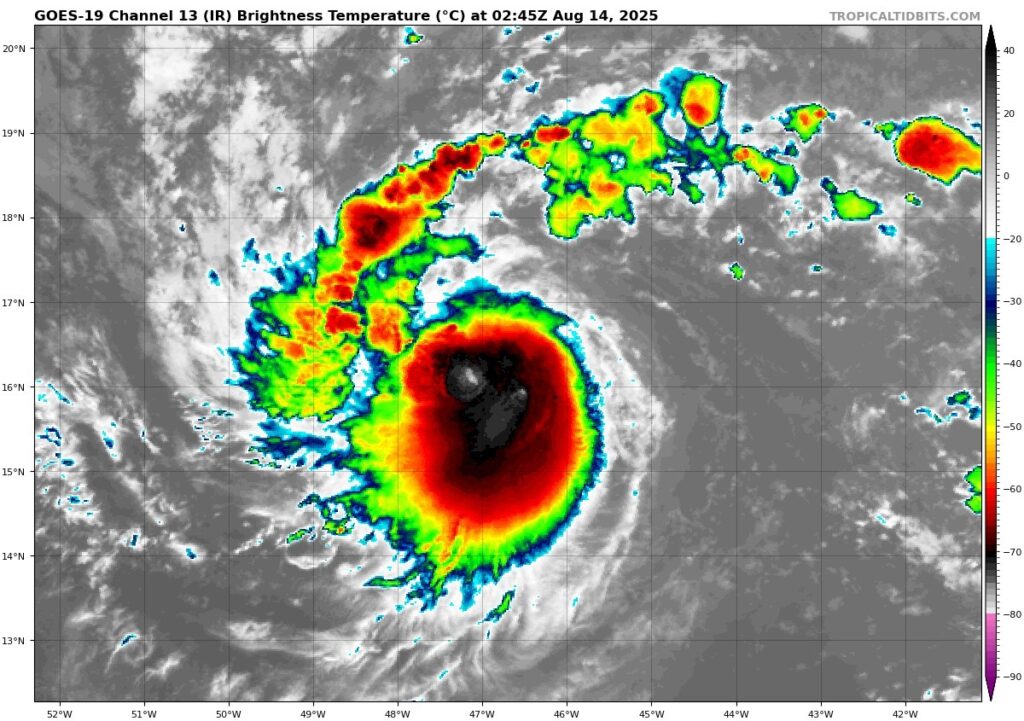
As of Wednesday evening, Tropical Storm Erin continues its journey across the open Atlantic, now packing sustained winds of 50 mph. Satellite imagery from GOES-19 reveals a storm that’s becoming increasingly organized. Erin now sports a more symmetric structure, with a well-defined central core and spiral bands radiating outward—hallmarks of a strengthening tropical system.
Infrared satellite data taken at 02:45Z on August 14 shows deep convection surrounding a potentially developing eye, with the coldest cloud tops (shown in red and black) indicating intense thunderstorm activity. This “mean face” look on satellite is often a visual cue that a storm is consolidating and may intensify further.
Forecast Track: A Critical Turn Ahead
Forecast models continue to project Erin moving east-northeast (ENE) over the next few days, with a northward turn expected later in the forecast period. However, the timing of this turn remains uncertain and is crucial in determining how close Erin gets to the U.S. East Coast.
Interestingly, the European model (ECMWF) shifted slightly westward today, standing out as an outlier compared to the rest of the guidance suite. While most models keep Erin offshore, any deviation in timing or track could bring more direct impacts to coastal areas.
Potential Impacts: Surf, Rip Currents, and Bermuda on Alert
At this stage, the primary hazards to the U.S. are expected to be large surf and dangerous rip currents, especially along the Mid-Atlantic and Northeast coasts. Some models have been adamant on 6-12 foot breakers for the LI and RI coastline. Meanwhile, the residents of Bermuda should remain on high alert. Depending on Erin’s eventual path, the island could experience tropical storm or even hurricane conditions depending on the exact track. The bad news for Bermuda is it appears it will be on the Eastern side of the storm, which often has more wind and surge.
Understanding Ensemble Models: Why Forecasts Vary
Forecast uncertainty—like what we’re seeing with Erin’s potential turn—is often explored using ensemble models. These models run the same storm simulation multiple times, each with slightly different initial conditions or physics. The result is a spread of possible outcomes, which helps forecasters gauge confidence and identify outliers.
For example:
- If most ensemble members agree on a track, confidence is high.
- If there’s a wide spread, forecasters know the situation is more uncertain.
- Outliers like today’s European model run are flagged for further scrutiny. European model is the red line below.
Ensemble modeling is a powerful tool in modern meteorology, helping to communicate not just what might happen—but how likely it is to happen. Most of the NHC forecasts are based off some version on this guidance.